The United Arab Emirates (UAE) is a country on the Arabian Peninsula. It is a federation of seven emirates; Abu Dhabi, Ajman, Dubai, Fujairah, Ras Al Khaimah, Sharjah and Umm Al Quwain. It is bordered by Oman and Saudi Arabia.
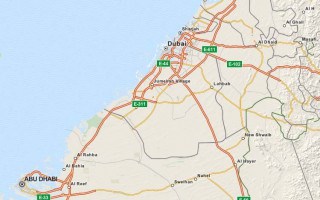
Abu Dhabi city, in the Emirate of Abu Dhabi, is the capital of the UAE. Dubai is the largest city by population.
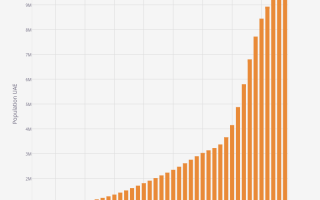
In recent years the UAE has seen significant changes. One of the most notable is a massive increase in its total population.
Total Population 2022
Data from the United Nations Department of Economic and Social Affairs shows the total population of the UAE in 2022 is 9,441,129.
Dubai and Abu Dhabi have the biggest populations.
Data from the Dubai Statistics Center (part of the Government of Dubai) shows that the current population of Dubai is over 3.5 million.
Each year the Abu Dhabi Statistics Centre release the Statistical Yearbook of Abu Dhabi. At the time of writing (September 2022), the latest publication is the Statistical Yearbook of Abu Dhabi 2020. This states that the population of Abu Dhabi in mid-2016 was estimated to be 2,908,000.
Abu Dhabi is the largest of the emirates by area, accounting for more than three-quarters of the area of the UAE. Abu Dhabi is divided into three regions; Abu Dhabi (population 1,807,000), Al Ain (population 767,000), and Al Dharfa (population 334,000).

UAE Population Growth
The historical population of the United Arab Emirates from 1950 to 2022 is shown in the table below:
| Year | Total Population, 1 July | Population Increase | Growth Rate (%) |
|---|---|---|---|
| 1950 | 74,591 | ||
| 1951 | 79,763 | 5,172 | 6.93 |
| 1952 | 85,091 | 5,328 | 6.68 |
| 1953 | 90,559 | 5,468 | 6.43 |
| 1954 | 96,136 | 5,577 | 6.16 |
| 1955 | 101,803 | 5,667 | 5.89 |
| 1956 | 107,563 | 5,760 | 5.66 |
| 1957 | 113,430 | 5,867 | 5.45 |
| 1958 | 119,606 | 6,176 | 5.44 |
| 1959 | 126,278 | 6,672 | 5.58 |
| 1960 | 133,426 | 7,148 | 5.66 |
| 1961 | 140,984 | 7,558 | 5.66 |
| 1962 | 148,877 | 7,893 | 5.60 |
| 1963 | 157,006 | 8,129 | 5.46 |
| 1964 | 165,305 | 8,299 | 5.29 |
| 1965 | 173,797 | 8,492 | 5.14 |
| 1966 | 182,509 | 8,712 | 5.01 |
| 1967 | 191,404 | 8,895 | 4.87 |
| 1968 | 213,582 | 22,178 | 11.59 |
| 1969 | 253,261 | 39,679 | 18.58 |
| 1970 | 298,084 | 44,823 | 17.70 |
| 1971 | 344,513 | 46,429 | 15.58 |
| 1972 | 392,368 | 47,855 | 13.89 |
| 1973 | 441,546 | 49,178 | 12.53 |
| 1974 | 491,955 | 50,409 | 11.42 |
| 1975 | 543,394 | 51,439 | 10.46 |
| 1976 | 614,177 | 70,783 | 13.03 |
| 1977 | 706,861 | 92,684 | 15.09 |
| 1978 | 805,231 | 98,370 | 13.92 |
| 1979 | 908,452 | 103,221 | 12.82 |
| 1980 | 1,014,048 | 105,596 | 11.62 |
| 1981 | 1,100,180 | 86,132 | 8.49 |
| 1982 | 1,167,856 | 67,676 | 6.15 |
| 1983 | 1,237,572 | 69,716 | 5.97 |
| 1984 | 1,308,331 | 70,759 | 5.72 |
| 1985 | 1,379,536 | 71,205 | 5.44 |
| 1986 | 1,468,697 | 89,161 | 6.46 |
| 1987 | 1,575,909 | 107,212 | 7.30 |
| 1988 | 1,683,681 | 107,772 | 6.84 |
| 1989 | 1,791,840 | 108,159 | 6.42 |
| 1990 | 1,900,151 | 108,311 | 6.04 |
| 1991 | 2,008,383 | 108,232 | 5.70 |
| 1992 | 2,116,231 | 107,848 | 5.37 |
| 1993 | 2,223,284 | 107,053 | 5.06 |
| 1994 | 2,329,024 | 105,740 | 4.76 |
| 1995 | 2,433,988 | 104,964 | 4.51 |
| 1996 | 2,572,735 | 138,747 | 5.70 |
| 1997 | 2,746,119 | 173,384 | 6.74 |
| 1998 | 2,921,130 | 175,011 | 6.37 |
| 1999 | 3,097,563 | 176,433 | 6.04 |
| 2000 | 3,275,333 | 177,770 | 5.74 |
| 2001 | 3,454,198 | 178,865 | 5.46 |
| 2002 | 3,633,655 | 179,457 | 5.20 |
| 2003 | 3,813,443 | 179,788 | 4.95 |
| 2004 | 3,993,339 | 179,896 | 4.72 |
| 2005 | 4,280,993 | 287,654 | 7.20 |
| 2006 | 4,898,954 | 617,961 | 14.43 |
| 2007 | 5,872,624 | 973,670 | 19.88 |
| 2008 | 6,988,685 | 1,116,061 | 19.00 |
| 2009 | 7,992,644 | 1,003,959 | 14.37 |
| 2010 | 8,481,771 | 489,127 | 6.12 |
| 2011 | 8,575,205 | 93,434 | 1.10 |
| 2012 | 8,664,969 | 89,764 | 1.05 |
| 2013 | 8,751,847 | 86,878 | 1.00 |
| 2014 | 8,835,951 | 84,104 | 0.96 |
| 2015 | 8,916,899 | 80,948 | 0.92 |
| 2016 | 8,994,263 | 77,364 | 0.87 |
| 2017 | 9,068,296 | 74,033 | 0.82 |
| 2018 | 9,140,169 | 71,873 | 0.79 |
| 2019 | 9,211,657 | 71,488 | 0.78 |
| 2020 | 9,287,289 | 75,632 | 0.82 |
| 2021 | 9,365,145 | 77,856 | 0.84 |
| 2022 | 9,441,129 | 75,984 | 0.81 |
Population statistics are taken from the World Population Prospects 2022 report, produced by the United Nations Department of Economic and Social Affairs.
At the time of its formation in 1971, the population of the UAE was 344,513. In the following decade, the annual rate of population growth was around 13%.
In the 1980s and 1990s, the annual population growth rate averaged around 6%.
Double-digit growth figures returned between 2005 and 2009. In recent years the rate of increase has been just under 1%.
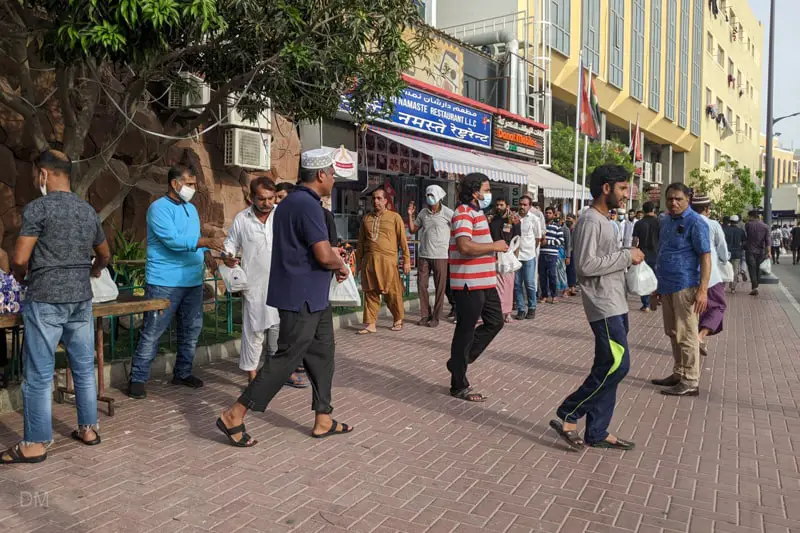
The huge increase in population can be attributed to significant numbers of migrants arriving in the UAE.

Construction booms have accounted for a large proportion of the growth. Huge numbers of labourers have been imported to build skyscrapers and new hotels; particularly in Dubai and Abu Dhabi.
The number of tourists visiting the UAE has also increased. Hotel and hospitality workers have migrated to service them.
Demographics – Gender Composition
Statistics from the United Nations show that the population of males in the UAE in 2022 stands at 6,547,744; 69.35% of the total population.
The female population of the UAE in 2022 is 2,893,385; 30.65% of the total population.
The The UAE is a country with a large migrant population. Many of the workers are men who have come to the UAE to work in the construction industry. They typically live in labour camps and are not allowed to bring their families with them.
Many other jobs filled by male migrant workers are low-paid. Such workers cannot afford to bring their families with them.
These factors have resulted in a gender imbalance in the UAE population.
The table below shows the total United Arab Emirates population from 1950 to 2022 broken down by gender.
| Year | Total Population, 1 July | Male Population, 1 July | Female Population, 1 July | Males (%) | Females (%) |
|---|---|---|---|---|---|
| 1950 | 74,591 | 39,043 | 35,548 | 52.34 | 47.66 |
| 1951 | 79,763 | 42,773 | 36,989 | 53.63 | 46.37 |
| 1952 | 85,091 | 46,625 | 38,467 | 54.79 | 45.21 |
| 1953 | 90,559 | 50,583 | 39,977 | 55.86 | 44.14 |
| 1954 | 96,136 | 54,629 | 41,508 | 56.82 | 43.18 |
| 1955 | 101,803 | 58,744 | 43,059 | 57.70 | 42.30 |
| 1956 | 107,563 | 62,928 | 44,635 | 58.50 | 41.50 |
| 1957 | 113,430 | 67,183 | 46,246 | 59.23 | 40.77 |
| 1958 | 119,606 | 71,590 | 48,016 | 59.85 | 40.15 |
| 1959 | 126,278 | 76,225 | 50,053 | 60.36 | 39.64 |
| 1960 | 133,426 | 81,077 | 52,349 | 60.77 | 39.23 |
| 1961 | 140,984 | 86,124 | 54,860 | 61.09 | 38.91 |
| 1962 | 148,877 | 91,333 | 57,544 | 61.35 | 38.65 |
| 1963 | 157,006 | 96,666 | 60,340 | 61.57 | 38.43 |
| 1964 | 165,305 | 102,102 | 63,204 | 61.77 | 38.23 |
| 1965 | 173,797 | 107,650 | 66,146 | 61.94 | 38.06 |
| 1966 | 182,509 | 113,319 | 69,190 | 62.09 | 37.91 |
| 1967 | 191,404 | 119,070 | 72,333 | 62.21 | 37.79 |
| 1968 | 213,582 | 135,631 | 77,950 | 63.50 | 36.50 |
| 1969 | 253,261 | 166,234 | 87,026 | 65.64 | 34.36 |
| 1970 | 298,084 | 200,546 | 97,538 | 67.28 | 32.72 |
| 1971 | 344,513 | 235,683 | 108,830 | 68.41 | 31.59 |
| 1972 | 392,368 | 271,546 | 120,822 | 69.21 | 30.79 |
| 1973 | 441,546 | 308,101 | 133,446 | 69.78 | 30.22 |
| 1974 | 491,955 | 345,330 | 146,625 | 70.20 | 29.80 |
| 1975 | 543,394 | 383,185 | 160,209 | 70.52 | 29.48 |
| 1976 | 614,177 | 434,554 | 179,623 | 70.75 | 29.25 |
| 1977 | 706,861 | 500,721 | 206,141 | 70.84 | 29.16 |
| 1978 | 805,231 | 569,890 | 235,341 | 70.77 | 29.23 |
| 1979 | 908,452 | 641,645 | 266,807 | 70.63 | 29.37 |
| 1980 | 1,014,048 | 714,328 | 299,721 | 70.44 | 29.56 |
| 1981 | 1,100,180 | 768,133 | 332,047 | 69.82 | 30.18 |
| 1982 | 1,167,856 | 804,030 | 363,825 | 68.85 | 31.15 |
| 1983 | 1,237,572 | 841,133 | 396,438 | 67.97 | 32.03 |
| 1984 | 1,308,331 | 878,846 | 429,484 | 67.17 | 32.83 |
| 1985 | 1,379,536 | 917,181 | 462,356 | 66.48 | 33.52 |
| 1986 | 1,468,697 | 973,514 | 495,183 | 66.28 | 33.72 |
| 1987 | 1,575,909 | 1,047,578 | 528,332 | 66.47 | 33.53 |
| 1988 | 1,683,681 | 1,122,008 | 561,673 | 66.64 | 33.36 |
| 1989 | 1,791,840 | 1,196,684 | 595,156 | 66.79 | 33.21 |
| 1990 | 1,900,151 | 1,271,462 | 628,689 | 66.91 | 33.09 |
| 1991 | 2,008,383 | 1,346,225 | 662,159 | 67.03 | 32.97 |
| 1992 | 2,116,231 | 1,420,821 | 695,410 | 67.14 | 32.86 |
| 1993 | 2,223,284 | 1,494,992 | 728,293 | 67.24 | 32.76 |
| 1994 | 2,329,024 | 1,568,420 | 760,604 | 67.34 | 32.66 |
| 1995 | 2,433,988 | 1,641,639 | 792,350 | 67.45 | 32.55 |
| 1996 | 2,572,735 | 1,739,745 | 832,990 | 67.62 | 32.38 |
| 1997 | 2,746,119 | 1,862,993 | 883,126 | 67.84 | 32.16 |
| 1998 | 2,921,130 | 1,987,116 | 934,014 | 68.03 | 31.97 |
| 1999 | 3,097,563 | 2,111,979 | 985,583 | 68.18 | 31.82 |
| 2000 | 3,275,333 | 2,237,588 | 1,037,745 | 68.32 | 31.68 |
| 2001 | 3,454,198 | 2,363,814 | 1,090,383 | 68.43 | 31.57 |
| 2002 | 3,633,655 | 2,490,318 | 1,143,337 | 68.53 | 31.47 |
| 2003 | 3,813,443 | 2,616,985 | 1,196,457 | 68.63 | 31.37 |
| 2004 | 3,993,339 | 2,743,771 | 1,249,569 | 68.71 | 31.29 |
| 2005 | 4,280,993 | 2,955,416 | 1,325,578 | 69.04 | 30.96 |
| 2006 | 4,898,954 | 3,428,088 | 1,470,867 | 69.98 | 30.02 |
| 2007 | 5,872,624 | 4,181,088 | 1,691,536 | 71.20 | 28.80 |
| 2008 | 6,988,685 | 5,044,718 | 1,943,966 | 72.18 | 27.82 |
| 2009 | 7,992,644 | 5,818,211 | 2,174,433 | 72.79 | 27.21 |
| 2010 | 8,481,771 | 6,174,991 | 2,306,780 | 72.80 | 27.20 |
| 2011 | 8,575,205 | 6,210,600 | 2,364,604 | 72.43 | 27.57 |
| 2012 | 8,664,969 | 6,244,376 | 2,420,594 | 72.06 | 27.94 |
| 2013 | 8,751,847 | 6,276,725 | 2,475,122 | 71.72 | 28.28 |
| 2014 | 8,835,951 | 6,307,775 | 2,528,177 | 71.39 | 28.61 |
| 2015 | 8,916,899 | 6,337,454 | 2,579,445 | 71.07 | 28.93 |
| 2016 | 8,994,263 | 6,365,662 | 2,628,601 | 70.77 | 29.23 |
| 2017 | 9,068,296 | 6,392,484 | 2,675,811 | 70.49 | 29.51 |
| 2018 | 9,140,169 | 6,418,331 | 2,721,838 | 70.22 | 29.78 |
| 2019 | 9,211,657 | 6,443,813 | 2,767,844 | 69.95 | 30.05 |
| 2020 | 9,287,289 | 6,475,368 | 2,811,921 | 69.72 | 30.28 |
| 2021 | 9,365,145 | 6,512,037 | 2,853,108 | 69.53 | 30.47 |
| 2022 | 9,441,129 | 6,547,744 | 2,893,385 | 69.35 | 30.65 |
Demographics – Age Groups
At the end of 2022, 41 per cent of the population of the UAE was concentrated in the 25-44 male age group.
The disproportionate number of foreign workers in the country, most of whom are male, results in this unnatural age and gender distribution.
| Age Group | 2022 Male | 2022 Female | 2022 Total | Total % | Male % of Total | Female % of Total |
|---|---|---|---|---|---|---|
| 0-4 | 248,550 | 232,590 | 481,140 | 5.10 | 2.63 | 2.46 |
| 5-9 | 255,255 | 238,513 | 493,768 | 5.23 | 2.70 | 2.53 |
| 10-14 | 240,711 | 222,470 | 463,181 | 4.91 | 2.55 | 2.36 |
| 15-19 | 155,377 | 166,601 | 321,978 | 3.41 | 1.65 | 1.76 |
| 20-24 | 401,626 | 140,522 | 542,147 | 5.74 | 4.25 | 1.49 |
| 25-29 | 860,013 | 262,801 | 1,122,813 | 11.89 | 9.11 | 2.78 |
| 30-34 | 1,092,016 | 408,705 | 1,500,721 | 15.90 | 11.57 | 4.33 |
| 35-39 | 1,086,412 | 393,817 | 1,480,228 | 15.68 | 11.51 | 4.17 |
| 40-44 | 848,681 | 300,926 | 1,149,607 | 12.18 | 8.99 | 3.19 |
| 45-49 | 571,954 | 199,276 | 771,230 | 8.17 | 6.06 | 2.11 |
| 50-54 | 375,375 | 121,726 | 497,100 | 5.27 | 3.98 | 1.29 |
| 55-59 | 212,866 | 76,917 | 289,783 | 3.07 | 2.25 | 0.81 |
| 60-64 | 106,050 | 48,712 | 154,762 | 1.64 | 1.12 | 0.52 |
| 65-69 | 47,055 | 29,674 | 76,728 | 0.81 | 0.50 | 0.31 |
| 70-74 | 20,055 | 18,332 | 38,387 | 0.41 | 0.21 | 0.19 |
| 75-79 | 10,169 | 11,095 | 21,264 | 0.23 | 0.11 | 0.12 |
| 80-84 | 8,318 | 10,267 | 18,585 | 0.20 | 0.09 | 0.11 |
| 85-89 | 5,835 | 7,815 | 13,650 | 0.14 | 0.06 | 0.08 |
| 90-94 | 1,180 | 2,100 | 3,280 | 0.03 | 0.01 | 0.02 |
| 95-99 | 244 | 499 | 743 | 0.01 | 0.00 | 0.01 |
| 100+ | 8 | 31 | 39 | 0.00 | 0.00 | 0.00 |
| Total | 6,547,744 | 2,893,385 | 9,441,129 | 100.00 | 69.35 | 30.65 |
Demographics – Nationalities
Data from the United Nations report International Migrant Stock 2020 shows that in 2020 there were 8,716,332 migrants in the UAE.
The total number of migrants is a staggering 88.1% of the total population of the UAE.
Local Emiratis are a minority in their own country. 6,419,792 of these migrants, or 73.7%, were male. 2,296,540 (26.3%) were women.
The ratio of men to women migrants is almost 3:1.
| Year | Total Migrants | Migrants (Males) | Migrants (Females) | Migrants Males (%) | Migrants Females (%) | Total UAE Population | Migrants (%) |
|---|---|---|---|---|---|---|---|
| 1990 | 1,306,574 | 931,959 | 374,615 | 71.33 | 28.67 | 1,828,437 | 71.46 |
| 1995 | 1,824,118 | 1,309,868 | 514,250 | 71.81 | 28.19 | 2,415,099 | 75.53 |
| 2000 | 2,447,010 | 1,757,200 | 689,810 | 71.81 | 28.19 | 3,134,067 | 78.08 |
| 2005 | 3,281,115 | 2,388,299 | 892,816 | 72.79 | 27.21 | 4,588,222 | 71.51 |
| 2010 | 7,316,697 | 5,463,446 | 1,853,251 | 74.67 | 25.33 | 8,549,998 | 85.58 |
| 2015 | 7,995,126 | 5,890,170 | 2,104,956 | 73.67 | 26.33 | 9,262,896 | 86.31 |
| 2020 | 8,716,332 | 6,419,792 | 2,296,540 | 73.65 | 26.35 | 9,890,400 | 88.13 |
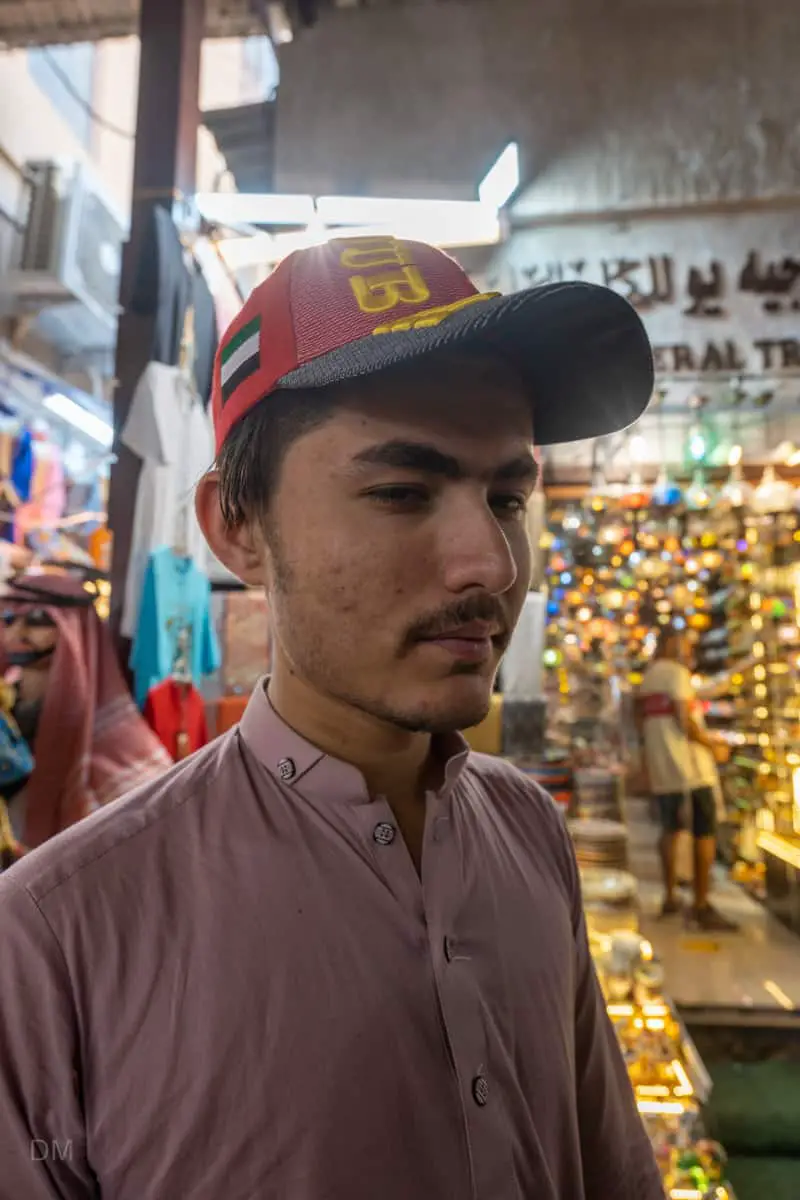
The nationality of the biggest expatriate group in the UAE is Indian. Almost 40% of the total number of migrants in the UAE are from India.
Other large Asian groups in the expatriate population include Bangladeshis, Pakistanis, Filipinos, Indonesians, Yemenis, Jordanians, Sri Lankans, Kuwaitis, Palestinians, Syrians, Lebanese, and Nepalis.
Egyptians are the largest group from Africa. There are also large numbers of Sudanese and Eritreans.
Fewer European expatriates are living in the UAE than commonly believed. British nationals are the largest group from Europe.
| Country | 1990 Number of Migrants | 1995 Number of Migrants | 2000 Number of Migrants | 2005 Number of Migrants | 2010 Number of Migrants | 2015 Number of Migrants | 2020 Number of Migrants | 1990 (%) | 1995 (%) | 2000 (%) | 2005 (%) | 2010 (%) | 2015 (%) | 2020 (%) |
|---|---|---|---|---|---|---|---|---|---|---|---|---|---|---|
| India | 458,294 | 667,853 | 915,878 | 1,286,993 | 2,913,858 | 3,184,043 | 3,471,300 | 35.08 | 36.61 | 37.43 | 39.22 | 39.82 | 39.82 | 39.83 |
| Bangladesh | 154,869 | 219,911 | 297,620 | 408,976 | 919,365 | 1,004,611 | 1,095,231 | 11.85 | 12.06 | 12.16 | 12.46 | 12.57 | 12.57 | 12.57 |
| Pakistan | 158,710 | 225,750 | 305,782 | 383,831 | 836,310 | 913,855 | 996,288 | 12.15 | 12.38 | 12.50 | 11.70 | 11.43 | 11.43 | 11.43 |
| Egypt | 165,980 | 207,924 | 261,934 | 341,789 | 755,158 | 825,178 | 899,612 | 12.70 | 11.40 | 10.70 | 10.42 | 10.32 | 10.32 | 10.32 |
| Philippines | 60,107 | 91,840 | 128,860 | 202,658 | 474,083 | 518,041 | 564,769 | 4.60 | 5.03 | 5.27 | 6.18 | 6.48 | 6.48 | 6.48 |
| Indonesia | 46,598 | 68,471 | 94,285 | 121,621 | 267,618 | 292,432 | 318,809 | 3.57 | 3.75 | 3.85 | 3.71 | 3.66 | 3.66 | 3.66 |
| Other | 19,018 | 42,674 | 68,837 | 97,866 | 222,431 | 243,071 | 265,010 | 1.46 | 2.34 | 2.81 | 2.98 | 3.04 | 3.04 | 3.04 |
| Yemen | 44,514 | 57,044 | 72,861 | 82,490 | 172,602 | 188,606 | 205,618 | 3.41 | 3.13 | 2.98 | 2.51 | 2.36 | 2.36 | 2.36 |
| Jordan | 26,078 | 35,757 | 47,494 | 63,626 | 141,838 | 154,989 | 168,968 | 2.00 | 1.96 | 1.94 | 1.94 | 1.94 | 1.94 | 1.94 |
| Sudan | 32,088 | 42,130 | 54,597 | 55,931 | 111,835 | 122,204 | 133,226 | 2.46 | 2.31 | 2.23 | 1.70 | 1.53 | 1.53 | 1.53 |
| Sri Lanka | 44,420 | 43,576 | 45,340 | 49,194 | 101,145 | 110,523 | 120,491 | 3.40 | 2.39 | 1.85 | 1.50 | 1.38 | 1.38 | 1.38 |
| Kuwait | 13,095 | 16,904 | 21,687 | 26,337 | 56,684 | 61,939 | 67,525 | 1.00 | 0.93 | 0.89 | 0.80 | 0.77 | 0.77 | 0.77 |
| State of Palestine | 11,602 | 14,868 | 18,995 | 22,830 | 48,946 | 53,484 | 58,308 | 0.89 | 0.82 | 0.78 | 0.70 | 0.67 | 0.67 | 0.67 |
| Syrian Arab Republic | 13,462 | 17,252 | 22,036 | 22,332 | 44,428 | 48,547 | 52,925 | 1.03 | 0.95 | 0.90 | 0.68 | 0.61 | 0.61 | 0.61 |
| Lebanon | 5,513 | 7,065 | 9,024 | 14,856 | 35,184 | 38,446 | 41,913 | 0.42 | 0.39 | 0.37 | 0.45 | 0.48 | 0.48 | 0.48 |
| Turkey | 9,781 | 12,534 | 16,050 | 16,152 | 32,055 | 35,027 | 38,186 | 0.75 | 0.69 | 0.66 | 0.49 | 0.44 | 0.44 | 0.44 |
| United Kingdom | 12,229 | 12,845 | 14,201 | 13,007 | 24,505 | 26,777 | 29,191 | 0.94 | 0.70 | 0.58 | 0.40 | 0.33 | 0.33 | 0.33 |
| Nepal | 1,730 | 2,217 | 2,832 | 8,818 | 23,410 | 25,580 | 27,886 | 0.13 | 0.12 | 0.12 | 0.27 | 0.32 | 0.32 | 0.32 |
| Eritrea | 3,846 | 4,928 | 6,295 | 7,570 | 16,231 | 17,735 | 19,334 | 0.29 | 0.27 | 0.26 | 0.23 | 0.22 | 0.22 | 0.22 |
| France | 434 | 1,118 | 1,868 | 5,745 | 15,230 | 16,642 | 18,141 | 0.03 | 0.06 | 0.08 | 0.18 | 0.21 | 0.21 | 0.21 |
| South Sudan | 3,951 | 5,187 | 6,723 | 6,751 | 13,368 | 14,607 | 15,922 | 0.30 | 0.28 | 0.27 | 0.21 | 0.18 | 0.18 | 0.18 |
| Nigeria | 1,417 | 1,815 | 2,319 | 5,207 | 13,178 | 14,399 | 15,697 | 0.11 | 0.10 | 0.09 | 0.16 | 0.18 | 0.18 | 0.18 |
| United States of America | 3,431 | 4,396 | 5,615 | 6,294 | 13,114 | 14,329 | 15,620 | 0.26 | 0.24 | 0.23 | 0.19 | 0.18 | 0.18 | 0.18 |
| Thailand | 2,228 | 2,855 | 3,647 | 4,842 | 10,763 | 11,760 | 12,819 | 0.17 | 0.16 | 0.15 | 0.15 | 0.15 | 0.15 | 0.15 |
| Ethiopia | 2,708 | 3,470 | 4,433 | 4,607 | 9,276 | 10,136 | 11,049 | 0.21 | 0.19 | 0.18 | 0.14 | 0.13 | 0.13 | 0.13 |
| Somalia | 2,578 | 3,304 | 4,221 | 4,165 | 8,173 | 8,930 | 9,734 | 0.20 | 0.18 | 0.17 | 0.13 | 0.11 | 0.11 | 0.11 |
| Morocco | 1,948 | 2,496 | 3,188 | 3,594 | 7,508 | 8,204 | 8,942 | 0.15 | 0.14 | 0.13 | 0.11 | 0.10 | 0.10 | 0.10 |
| Afghanistan | 1,630 | 2,088 | 2,668 | 3,208 | 6,878 | 7,515 | 8,191 | 0.12 | 0.11 | 0.11 | 0.10 | 0.09 | 0.09 | 0.09 |
| Saudi Arabia | 465 | 1,005 | 1,604 | 2,395 | 5,524 | 6,036 | 6,579 | 0.04 | 0.06 | 0.07 | 0.07 | 0.08 | 0.08 | 0.08 |
| Tunisia | 1,175 | 1,505 | 1,922 | 2,303 | 4,932 | 5,389 | 5,874 | 0.09 | 0.08 | 0.08 | 0.07 | 0.07 | 0.07 | 0.07 |
| Chad | 1,063 | 1,361 | 1,739 | 2,094 | 4,493 | 4,909 | 5,350 | 0.08 | 0.07 | 0.07 | 0.06 | 0.06 | 0.06 | 0.06 |
| Netherlands | 1,320 | 1,346 | 1,450 | 1,378 | 2,651 | 2,896 | 3,155 | 0.10 | 0.07 | 0.06 | 0.04 | 0.04 | 0.04 | 0.04 |
| Qatar | 61 | 131 | 210 | 824 | 2,244 | 2,452 | 2,671 | 0.00 | 0.01 | 0.01 | 0.03 | 0.03 | 0.03 | 0.03 |
| Bahrain | 231 | 498 | 795 | 831 | 1,679 | 1,834 | 1,998 | 0.02 | 0.03 | 0.03 | 0.03 | 0.02 | 0.02 | 0.02 |
| Total | 1,306,574 | 1,824,118 | 2,447,010 | 3,281,115 | 7,316,697 | 7,995,126 | 8,716,332 | 100.00 | 100.00 | 100.00 | 100.00 | 100.00 | 100.00 | 100.00 |
Life Expectancy
Life expectancy at birth in the UAE between 1950 and 2022 is shown in the table below:
| Year | Life Expectancy at Birth, Both Sexes (years) | Male Life Expectancy at Birth (years) | Female Life Expectancy at Birth (years) |
|---|---|---|---|
| 1950 | 41.1 | 38.2 | 44.5 |
| 1951 | 41.4 | 38.5 | 44.8 |
| 1952 | 42.2 | 39.4 | 45.7 |
| 1953 | 42.8 | 40.1 | 46.3 |
| 1954 | 43.6 | 41.0 | 47.1 |
| 1955 | 44.4 | 41.8 | 47.8 |
| 1956 | 45.2 | 42.7 | 48.6 |
| 1957 | 46.0 | 43.6 | 49.4 |
| 1958 | 47.0 | 44.7 | 50.3 |
| 1959 | 47.9 | 45.6 | 51.1 |
| 1960 | 48.8 | 46.6 | 52.0 |
| 1961 | 49.7 | 47.6 | 52.8 |
| 1962 | 50.7 | 48.6 | 53.8 |
| 1963 | 51.6 | 49.6 | 54.6 |
| 1964 | 52.8 | 51.0 | 55.8 |
| 1965 | 54.0 | 52.1 | 56.9 |
| 1966 | 55.2 | 53.3 | 58.2 |
| 1967 | 56.3 | 54.4 | 59.4 |
| 1968 | 57.5 | 55.7 | 60.5 |
| 1969 | 58.8 | 57.0 | 61.8 |
| 1970 | 60.0 | 58.2 | 63.1 |
| 1971 | 61.2 | 59.5 | 64.3 |
| 1972 | 62.3 | 60.7 | 65.2 |
| 1973 | 63.4 | 61.7 | 66.5 |
| 1974 | 64.3 | 62.7 | 67.2 |
| 1975 | 65.1 | 63.5 | 68.0 |
| 1976 | 65.8 | 64.2 | 68.8 |
| 1977 | 66.5 | 64.9 | 69.5 |
| 1978 | 67.2 | 65.6 | 70.3 |
| 1979 | 67.8 | 66.2 | 71.0 |
| 1980 | 68.5 | 66.9 | 71.7 |
| 1981 | 69.1 | 67.5 | 72.0 |
| 1982 | 69.7 | 68.0 | 72.6 |
| 1983 | 69.9 | 68.3 | 72.9 |
| 1984 | 70.5 | 68.8 | 73.4 |
| 1985 | 70.7 | 69.1 | 73.6 |
| 1986 | 71.0 | 69.3 | 73.8 |
| 1987 | 71.5 | 69.8 | 74.5 |
| 1988 | 71.6 | 69.9 | 74.6 |
| 1989 | 71.8 | 70.1 | 74.8 |
| 1990 | 71.9 | 70.3 | 74.9 |
| 1991 | 72.2 | 70.7 | 75.0 |
| 1992 | 72.3 | 70.8 | 75.0 |
| 1993 | 72.5 | 70.9 | 75.5 |
| 1994 | 72.6 | 71.0 | 75.6 |
| 1995 | 72.7 | 71.2 | 75.6 |
| 1996 | 72.8 | 71.4 | 75.3 |
| 1997 | 72.9 | 71.6 | 75.5 |
| 1998 | 73.1 | 71.7 | 75.7 |
| 1999 | 73.7 | 72.3 | 76.2 |
| 2000 | 74.4 | 73.2 | 76.6 |
| 2001 | 74.6 | 73.4 | 77.0 |
| 2002 | 74.9 | 73.6 | 77.4 |
| 2003 | 76.2 | 75.0 | 78.5 |
| 2004 | 76.5 | 75.2 | 78.8 |
| 2005 | 76.7 | 75.4 | 79.0 |
| 2006 | 76.9 | 75.6 | 79.3 |
| 2007 | 77.1 | 75.8 | 79.5 |
| 2008 | 77.5 | 76.0 | 79.8 |
| 2009 | 78.0 | 76.2 | 80.0 |
| 2010 | 78.3 | 76.5 | 80.2 |
| 2011 | 78.5 | 76.7 | 80.4 |
| 2012 | 78.7 | 76.9 | 80.6 |
| 2013 | 78.9 | 77.1 | 80.8 |
| 2014 | 79.0 | 77.3 | 81.0 |
| 2015 | 79.2 | 77.6 | 81.2 |
| 2016 | 79.3 | 77.7 | 81.4 |
| 2017 | 79.5 | 77.9 | 81.6 |
| 2018 | 79.6 | 78.0 | 81.8 |
| 2019 | 79.7 | 78.2 | 81.9 |
| 2020 | 78.9 | 77.5 | 81.1 |
| 2021 | 78.7 | 77.2 | 80.9 |
| 2022 | 79.2 | 77.7 | 81.4 |
The data is from the World Population Prospects 2022 report, produced by the United Nations Department of Economic and Social Affairs, Population Division.
In 2022 in the UAE, life expectancy at birth is 79.2 years. This is higher than the global average of 71.7 years and the average of 74.6 years for Western Asia (the region that includes the UAE).
Several factors contribute to the high life expectancy in the UAE. One of the most important factors is the high quality of healthcare in the UAE. The UAE has some of the best hospitals in the world. These hospitals are well-equipped with the latest technology and have highly trained staff.
Factors Influencing UAE Population Growth
The population of the country has increased significantly in recent years. Immigration is the key factor driving this growth.
People from all walks of life choose to relocate to the United Arab Emirates for many different reasons. They include:
- Strong economy – The UAE has a high GDP and a strong and diversified economy. It is the largest economy in the Arab world after Saudi Arabia. Important sectors include oil, gas, tourism, and international finance. Although there are many low-paid jobs in the country, salaries earned by expatriates are usually higher than those offered in their home countries.
- Good infrastructure – The UAE has excellent infrastructure, transport links, healthcare and educational facilities.
- Visa rules – Visa regulations are liberal. The UAE is keen to attract foreign talent and expertise, and its visa policies are designed to encourage this. The country recognises that its economy is heavily dependent on foreign workers, and so it is in its interests to make it as easy as possible for them to come and live in the country. The UAE is home to a large number of multinational companies. These companies often need to transfer employees from one country to another, and the UAE’s visa policies make this process much easier.
- Tax-free status – The UAE has no income tax. This makes it an attractive destination for foreign citizens. It also has many free trade zones. These offer benefits such as 100% foreign ownership and business tax exemptions. These trade zones are attractive locations for business owners and entrepreneurs wishing to relocate.
- Political stability – It is a politically stable country. It has not been affected by the instability and violence seen in other countries in the region.
- Climate – The weather in the UAE is hot and sunny all year round which makes it a great place to live if you enjoy the outdoors.
- Safety – The UAE has a very low crime rate. This makes it a very safe place to live.
- Tolerant – It is a tolerant society. Islam is the official religion but people of all religions and nationalities are welcome.
These factors have resulted in a high net migration rate and a significant influx of people from all over the world to the UAE.
Population Forecast
The population forecast for the UAE from 2023 to 2040 is shown in the table below:
Population figures are taken from the report World Population Prospects 2022 report (medium fertility variant), produced by the United Nations Department of Economic and Social Affairs.
| Year | Total Population, 1 July | Male Population, 1 July | Female Population, 1 July | Males (%) | Females (%) | Population Increase | Growth Rate (%) |
|---|---|---|---|---|---|---|---|
| 2022 | 9,441,129 | 6,547,744 | 2,893,385 | 69.35 | 30.65 | ||
| 2023 | 9,516,871 | 6,583,587 | 2,933,285 | 69.18 | 30.82 | 75,742 | 0.80 |
| 2024 | 9,591,853 | 6,619,150 | 2,972,704 | 69.01 | 30.99 | 74,982 | 0.79 |
| 2025 | 9,665,319 | 6,653,918 | 3,011,401 | 68.84 | 31.16 | 73,466 | 0.77 |
| 2026 | 9,737,048 | 6,687,778 | 3,049,270 | 68.68 | 31.32 | 71,729 | 0.74 |
| 2027 | 9,806,692 | 6,720,547 | 3,086,144 | 68.53 | 31.47 | 69,644 | 0.72 |
| 2028 | 9,874,281 | 6,752,229 | 3,122,052 | 68.38 | 31.62 | 67,589 | 0.69 |
| 2029 | 9,940,085 | 6,782,944 | 3,157,140 | 68.24 | 31.76 | 65,804 | 0.67 |
| 2030 | 10,004,319 | 6,812,803 | 3,191,516 | 68.10 | 31.90 | 64,234 | 0.65 |
| 2031 | 10,067,403 | 6,842,012 | 3,225,391 | 67.96 | 32.04 | 63,084 | 0.63 |
| 2032 | 10,130,008 | 6,870,900 | 3,259,108 | 67.83 | 32.17 | 62,605 | 0.62 |
| 2033 | 10,192,521 | 6,899,654 | 3,292,867 | 67.69 | 32.31 | 62,513 | 0.62 |
| 2034 | 10,255,434 | 6,928,522 | 3,326,912 | 67.56 | 32.44 | 62,913 | 0.62 |
| 2035 | 10,319,346 | 6,957,804 | 3,361,543 | 67.42 | 32.58 | 63,912 | 0.62 |
| 2036 | 10,384,576 | 6,987,645 | 3,396,932 | 67.29 | 32.71 | 65,230 | 0.63 |
| 2037 | 10,451,479 | 7,018,219 | 3,433,260 | 67.15 | 32.85 | 66,903 | 0.64 |
| 2038 | 10,520,193 | 7,049,597 | 3,470,595 | 67.01 | 32.99 | 68,714 | 0.66 |
| 2039 | 10,590,827 | 7,081,817 | 3,509,010 | 66.87 | 33.13 | 70,634 | 0.67 |
| 2040 | 10,663,646 | 7,114,994 | 3,548,651 | 66.72 | 33.28 | 72,819 | 0.69 |