In just a few decades, Dubai has transformed itself from a desert backwater into one of the most vibrant and cosmopolitan cities in the world. And now, the city is aiming to become the most visited tourist destination on the planet, with a new tourism strategy that is targeting 25 million visitors by 2025.
To achieve this goal, the city is investing heavily in infrastructure, hotels, tourist attractions, and shopping malls.
The city has already taken steps to improve its infrastructure and visitor experience.
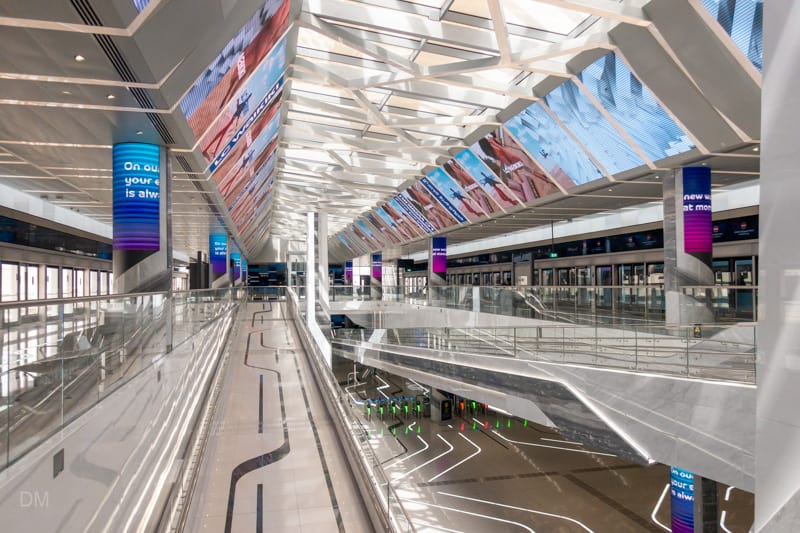
The extension to the Red Line of the Dubai Metro has made it possible for visitors to reach new areas of Dubai that were previously difficult to reach by public transport.
Dubai is constantly evolving, and there are always new attractions to see and experience.
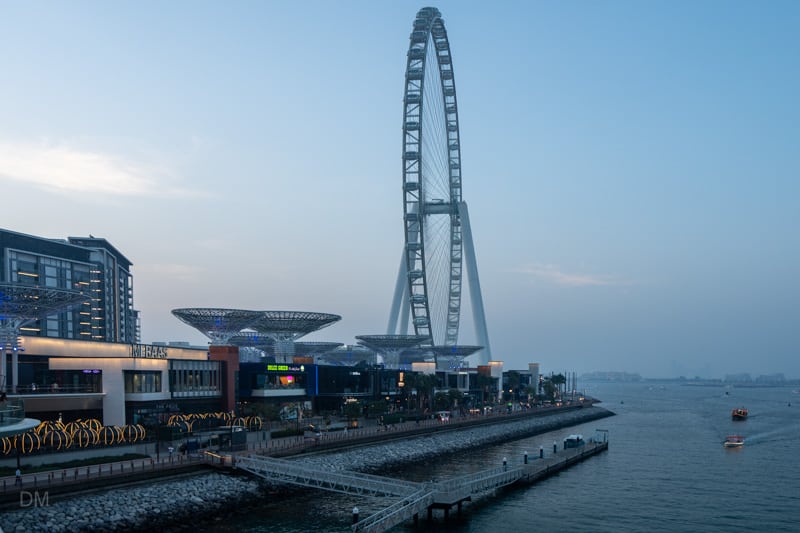
One of the latest additions to the city is Ain Dubai, which is the world’s tallest Ferris wheel. For those who want to get a bird’s-eye view of the city, this is a must-see attraction. The View at the Palm also offers stunning panoramic views.
The Museum of the Future is a one-of-a-kind institution that explores the latest technological innovations, while Madame Tussauds Dubai brings iconic celebrities to life with lifelike wax figures.
These new attractions are sure to wow visitors and continue to put Dubai on the map as a must-see destination.
The city is home to some of the most luxurious and opulent hotels in the world, and new properties are being built all the time. Hilton Dubai Palm Jumeirah, Atlantis the Royal, and W Dubai Mina Seyahi are just three of the hotels that opened in 2022.
These developments have made Dubai even more appealing to tourists from all over the world. There is no doubt that it is on track to becoming the most visited city on earth.
Number of International Visitors to Dubai – January to June 2022
According to the latest figures from the Dubai Department of Economy and Tourism, the number of international visitors to Dubai in the first six months of 2022 was 7.12 million. This represents an increase of over 182 per cent over the same period in 2021.
However, it is important to note that 2021 and 2020 were both affected by the COVID-19 pandemic, so a more accurate comparison is with pre-pandemic figures.
In the first half of 2019, 8.36 million tourists visited the city. This means that while there has been an increase in tourism since the pandemic began, the number of tourists has not yet returned to its pre-pandemic levels.
Much of the difference between the 2022 and 2019 figures is due to the loss of Chinese tourists. In the first 6 months of 2019, 501,000 Chinese tourists visited Dubai. In 2022, China’s borders remained effectively sealed as the country continued to pursue a zero-tolerance approach to a virus that other parts of the world have accepted as endemic.
However, with vaccines now available and travel restrictions beginning to ease, it is expected that Dubai will soon return to the pre-pandemic growth levels.
Number of International Visitors to Dubai – 2021
After a difficult year in 2020, Dubai’s tourism industry saw a rebound in visitor numbers in 2021. With global travel ramping up and COVID-19 restrictions easing, the city welcomed back tourists from all over the world.
In total, 7.28 million visitors arrived in the city in 2021, compared to 5.51 million in 2020. This was a significant increase of over 32 per cent.
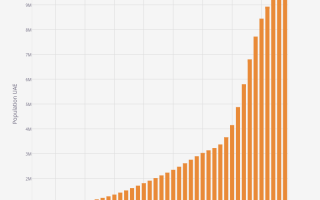
| Year | Total Visitors | Increase/(Decrease) | Increase/(Decrease) % |
|---|---|---|---|
| 2014 | 13,200,000 | ||
| 2015 | 14,200,000 | 1,000,000 | 7.58 |
| 2016 | 14,900,000 | 700,000 | 4.93 |
| 2017 | 15,790,000 | 890,000 | 5.97 |
| 2018 | 15,920,000 | 130,000 | 0.82 |
| 2019 | 16,730,000 | 810,000 | 5.09 |
| 2020 | 5,510,000 | (11,220,000) | (67.07) |
| 2021 | 7,280,000 | 1,770,000 | 32.12 |
Origin of International Visitors to Dubai – January to June 2022
According to the statistics for the first half of 2022, the top five countries of origin for visitors are India, Oman, Saudi Arabia, the UK, and Russia.
These five countries account for over 40 per cent of all visitors to Dubai. However, it’s worth noting that there are a significant number of visitors from other countries as well.
| Country of Origin | Visitors January to June 2022 |
|---|---|
| India | 858,000 |
| Oman | 787,000 |
| Saudi Arabia | 543,000 |
| UK | 506,000 |
| Russia | 309,000 |
| USA | 262,000 |
| France | 219,000 |
| Germany | 215,000 |
| Pakistan | 193,000 |
| Iran | 165,000 |
| Egypt | 135,000 |
| Kuwait | 122,000 |
| Italy | 119,000 |
| Israel | 114,000 |
| Kazakhstan | 113,000 |
| Netherlands | 86,000 |
| Australia | 72,000 |
| Canada | 71,000 |
| Sudan | 70,000 |
| Nigeria | 68,000 |
| Other | 2,093,000 |
| Total | 7,120,000 |
Origin of International Visitors to Dubai – 2021
India has always been an important market for Dubai’s tourism sector, and that was no different in 2021. India remained the city’s top international visitor source market, accounting for 910,000 visitors. That’s a 5.2% increase from the previous year.
Many factors have contributed to India being the top source of visitors. One is the abundance of direct flights that make it convenient and affordable for Indian travellers to visit Dubai. Another is the wide range of hotel options, which appeals to a broad range of travellers.
Saudi Arabia had the second highest number of visitors in 2021 with 491,000 visitors. This was an increase of over 22 per cent from the previous year. This is a very impressive result, especially considering that Saudi Arabia closed its borders to all travel up to May 2021.
Russia was again one of the city’s largest tourism source markets, with 444,000 visitors in 2021, an increase of 50 per cent from the previous year.
Visitors from Oman, historically one of Dubai’s top five source markets, were significantly reduced in 2021 due to COVID-19 travel restrictions. The Omani government reopened its borders with the UAE to vaccinated travellers in September 2021.
| Country of Origin | Visitors 2021 |
|---|---|
| India | 910,000.00 |
| Saudi Arabia | 491,000.00 |
| Russia | 444,000.00 |
| UK | 420,000.00 |
| USA | 311,000.00 |
| France | 291,000.00 |
| Oman | 280,000.00 |
| Pakistan | 247,000.00 |
| Germany | 240,000.00 |
| Egypt | 218,000.00 |
| Kazakhstan | 164,000.00 |
| Iran | 154,000.00 |
| Ethiopia | 139,000.00 |
| Ukraine | 112,000.00 |
| Sudan | 111,000.00 |
| Italy | 106,000.00 |
| Israel | 97,000.00 |
| Netherlands | 89,000.00 |
| Lebanon | 81,000.00 |
| Jordan | 78,000.00 |
| Other | 2,297,000.00 |
| Total | 7,280,000.00 |
Visitors by Source Market – January to June 2022 and 2021
Western Europe and GCC countries (Bahrain, Kuwait, Oman, Qatar, and Saudi Arabia) were the top source markets for the city in the first 6 months of 2022.
As noted above, Oman and Saudi Arabia have historically been amongst Dubai’s top international visitor source markets. Both of these GCC countries had strict travel restrictions in place for much of 2021.
| Region | January to June 2022 (%) | 2021 (%) |
|---|---|---|
| Western Europe | 22 | 22 |
| GCC | 22 | 13 |
| South Asia | 16 | 18 |
| MENA | 12 | 13 |
| Russia, CIS, Eastern Europe | 11 | 15 |
| Americas | 7 | 7 |
| Africa | 5 | 8 |
| North Asia and South-East Easia | 4 | 3 |
| Australasia | 1 | 1 |
| 100 | 100 |
Purpose of Visit
The data for 2021 and previous years shows that most people travel to Dubai for leisure reasons, whether it be to enjoy the city’s many attractions or to relax in its luxurious hotels and resorts. Business travellers accounted for 12 per cent of all visitors to the city in 2021, which was consistent with 2020. Many business visitors are attracted by events such as GITEX and the Arabian Travel Market.
The proportion of travellers visiting the city to see friends and relatives in 2021 rose to 16 per cent, up 3 per cent from 2020.
| Purpose of Visit | 2021 (%) | 2020 (%) | 2019 (%) |
|---|---|---|---|
| Business | 12 | 12 | 14 |
| Leisure | 71 | 74 | 75 |
| Visit Friends or Relatives | 16 | 13 | 10 |
| Other | 1 | 1 | 1 |
| 100 | 100 | 100 |
Hotels – Room Nights
In 2021, hotels in Dubai bounced back from the pandemic with some of their best results ever.
Thanks to a strong rise in the number of domestic guests, the city’s hotel industry had the second highest number of room nights sold on record. The remarkable figure of 31.47 million was only slightly down on the pre-pandemic peak of 32.11 million recorded in 2019.
Guests also stayed longer in 2021, averaging 4.6 nights compared to 4.2 nights the year before.
| Year | Room Nights | Average Length of Stay (days) | Average Daily Rate (AED) |
|---|---|---|---|
| 2021 | 31,470,000 | 4.60 | 451.00 |
| 2020 | 20,480,000 | 4.20 | 343.00 |
| 2019 | 32,110,000 | 3.40 | 415.00 |
| 2018 | 30,130,000 | 3.50 | 465.00 |
| 2017 | 29,210,000 | 3.50 | 492.00 |
| 2016 | 28,000,000 | 3.60 | 511.00 |
| 2015 | 26,400,000 | 3.60 | 569.00 |
Hotels – Number and Occupancy
In 2021, Dubai offered more hotel choices to travellers, as the city’s hotel room inventory grew. At the end of the year, the city had a total of 755 hotels and hotel apartments with 137,950 rooms available. This is compared to 711 hotels and hotel apartments with 126,947 rooms at the end of 2020.
This increase in the number of hotel rooms provided travellers with more options to find lodging that met their needs and budget.
The average hotel occupancy rate in 2021 was 67 per cent, up from 54 per cent in 2020.
| Property Type | Number of Establishments 2021 | Room Supply 2021 | Occupancy Rate (%) 2021 | Number of Establishments 2020 | Room Supply 2020 | Occupancy Rate (%) 2020 | Number of Establishments 2019 | Room Supply 2019 | Occupancy Rate (%) 2019 | Number of Establishments 2018 | Room Supply 2018 | Occupancy Rate (%) 2018 |
|---|---|---|---|---|---|---|---|---|---|---|---|---|
| 5 Star Hotels | 143 | 47,035 | 61 | 134 | 44,067 | 45 | 128 | 43,133 | 74 | 113 | 38,543 | 76 |
| 4 Star Hotels | 181 | 40,377 | 66 | 161 | 34,905 | 53 | 158 | 33,120 | 75 | 146 | 29,908 | 75 |
| 1 - 3 Star Hotels | 243 | 25,384 | 68 | 225 | 21,732 | 59 | 258 | 24,491 | 75 | 260 | 22,634 | 75 |
| Deluxe Hotel Apartments | 80 | 12,606 | 75 | 74 | 11,845 | 63 | 68 | 10,520 | 77 | 68 | 10,522 | 78 |
| Standard Hotel Apartments | 108 | 12,548 | 81 | 117 | 14,398 | 66 | 129 | 14,856 | 77 | 129 | 14,360 | 78 |
| Total | 755 | 137,950 | 67 | 711 | 126,947 | 54 | 741 | 126,120 | 75 | 716 | 115,967 | 76 |
Hotels – Location
Hotels and hotel apartments are found in many areas of Dubai.
The areas with the greatest number of rooms are Deira, Al Barsha, Jumeirah, Downtown Dubai, and Dubai Marina.
The Palm Jumeirah has the highest proportion of 5-star rooms. 87 per cent of available rooms here are in 5-star hotels. Bur Dubai has the lowest proportion of 5-star rooms.
Jebel Ali and Deira are best for budget visitors. In both of these areas, the proportion of rooms in 1 to 3-star hotels is just under 40 per cent.
| Area | Total Number of Rooms # | 5 Star # | 4 Star # | 1 - 3 Star # | Hotel Apartments # | 5 Star % | 4 Star % | 1 - 3 Star % | Hotel Apartments % |
|---|---|---|---|---|---|---|---|---|---|
| Trade Centre | 5,870 | 2,269 | 2,402 | 798 | 401 | 39% | 41% | 14% | 7% |
| Jebel Ali | 6,230 | 1,191 | 1,720 | 2,425 | 894 | 19% | 28% | 39% | 14% |
| Palm Jumeirah | 7,305 | 6,324 | 208 | - | 773 | 87% | 3% | 0% | 11% |
| Oud Metha | 7,460 | 3,028 | 1,415 | 1,586 | 1,431 | 41% | 19% | 21% | 19% |
| Bur Dubai | 10,841 | 1,127 | 4,462 | 1,949 | 3,303 | 10% | 41% | 18% | 30% |
| Dubai Marina | 11,178 | 6,187 | 2,382 | 435 | 2,174 | 55% | 21% | 4% | 19% |
| Other | 11,198 | 2,751 | 3,891 | 2,120 | 2,436 | 25% | 35% | 19% | 22% |
| Downtown Dubai | 13,779 | 9,098 | 2,154 | 420 | 2,107 | 66% | 16% | 3% | 15% |
| Jumeirah | 16,440 | 8,200 | 2,868 | 2,468 | 2,904 | 50% | 17% | 15% | 18% |
| Al Barsha | 17,923 | 2,561 | 8,831 | 1,974 | 4,557 | 14% | 49% | 11% | 25% |
| Deira | 29,726 | 4,299 | 10,044 | 11,209 | 4,174 | 14% | 34% | 38% | 14% |
| Total | 137,950 | 47,035 | 40,377 | 25,384 | 25,154 | 34% | 29% | 18% | 18% |
Top World Cities by Visitor Numbers
According to Mastercard’s Global Destination Cities Index 2018 (published September 2019), Dubai was the fourth most visited city in the world. Only Bangkok, Paris, and London attracted more overnight visitors.
Dubai was the most visited city in the United Arab Emirates and the Middle East.
Dubai topped the list for both total and average daily visitor spending. The average visitor to the city spent $533 (£464.17, €538.95, 1957.76 AED) per day in 2018, much higher than in any of the other cities.
Total visitor spending in Dubai for the year was $30.82 billion.
At the time of writing (September 2022), Mastercard has not published the report for any years after 2018.
Dubai International Airport Passenger Numbers
According to a report from Airports Council International (published in April 2022), Dubai International Airport (DXB) was the world’s busiest airport in 2021 in terms of international passenger traffic.
The busiest airport in terms of total passengers (international and domestic) was Hartsfield–Jackson Atlanta International Airport (ATL).
The UAE is a small country. There are no domestic flights from Dubai International Airport or any other airport in the UAE (Abu Dhabi, Dubai, Sharjah, Ajman, Umm Al-Quwain, Fujairah, and Ras Al Khaimah).
Airports Council International (ACI) is the trade association of the world’s airports.
Top Tourist Attractions
According to Tripadvisor the most popular tourist attractions in Dubai (September 2022) are:
- Burj Khalifa
- Dubai Fountain
- Dubai Mall
- Dubai Miracle Garden
- Global Village
- Dubai Frame
- Atlantis Aquaventure
- La Mer
- Burj Al Arab
- Ski Dubai
- Dubai Creek
- Dubai Aquarium and Underwater Zoo
- Mall of the Emirates
- The Lost Chambers
- Wild Wadi
- Souk Madinat Jumeirah
- Motiongate
- Dubai Marina
- LEGOLAND Dubai
- Al Seef

Tripadvisor is a travel website that helps users find hotels, restaurants, and activities for their upcoming trips. The website also includes user-generated reviews and ratings, as well as photos and videos. It is a great resource for travellers who want to get the most out of their trip.